When reports arrive — and where to find them
Reports generate automatically on the 3rd of the month. You never trigger one yourself — Huntit builds each client's report, stores it, and rings your bell when it's ready. The Monthly report generates every month; the Quarterly report generates four times a year, in February, May, August, and November.
Why the 3rd, not the 1st
A post becomes eligible for an engagement win from its third day. Running on the 3rd gives every post published in the just-closed month its first engagement read, so the report captures the month honestly rather than cutting it off early.
The numbers are shown "as of" the generation date. A few late wins may still join after it, and the report's footer says so — which is why a Monthly report never claims its month is fully settled.
The two cadences
- Monthly report — generates every month, reading the month that just closed. It's the fast pulse: what happened in your client's market this month.
- Quarterly report — generates on the 3rd of February, May, August and November. It reads the three most recent fully-mature calendar months, every post past its final checkpoint, so it's the settled strategy layer.
That leaves each quarter reading two months back:
| Generated in | Window |
|---|---|
| February | October – December |
| May | January – March |
| August | April – June |
| November | July – September |
A client-period with zero tracked posts is skipped entirely — no report, no bell. There's nothing to report, so nothing is generated.
How you find out
When the batch lands, you get a single notification: one digest per account manager per generation run, naming the clients that manager covers. It doesn't list every report as its own row, so the 3rd never floods your bell. The reports page always shows everything that's ready.
Huntit never sends a report to your client. Generation and delivery are separate: Huntit builds the report; you share the link yourself when you're ready. There is no auto-send.
Where the reports live
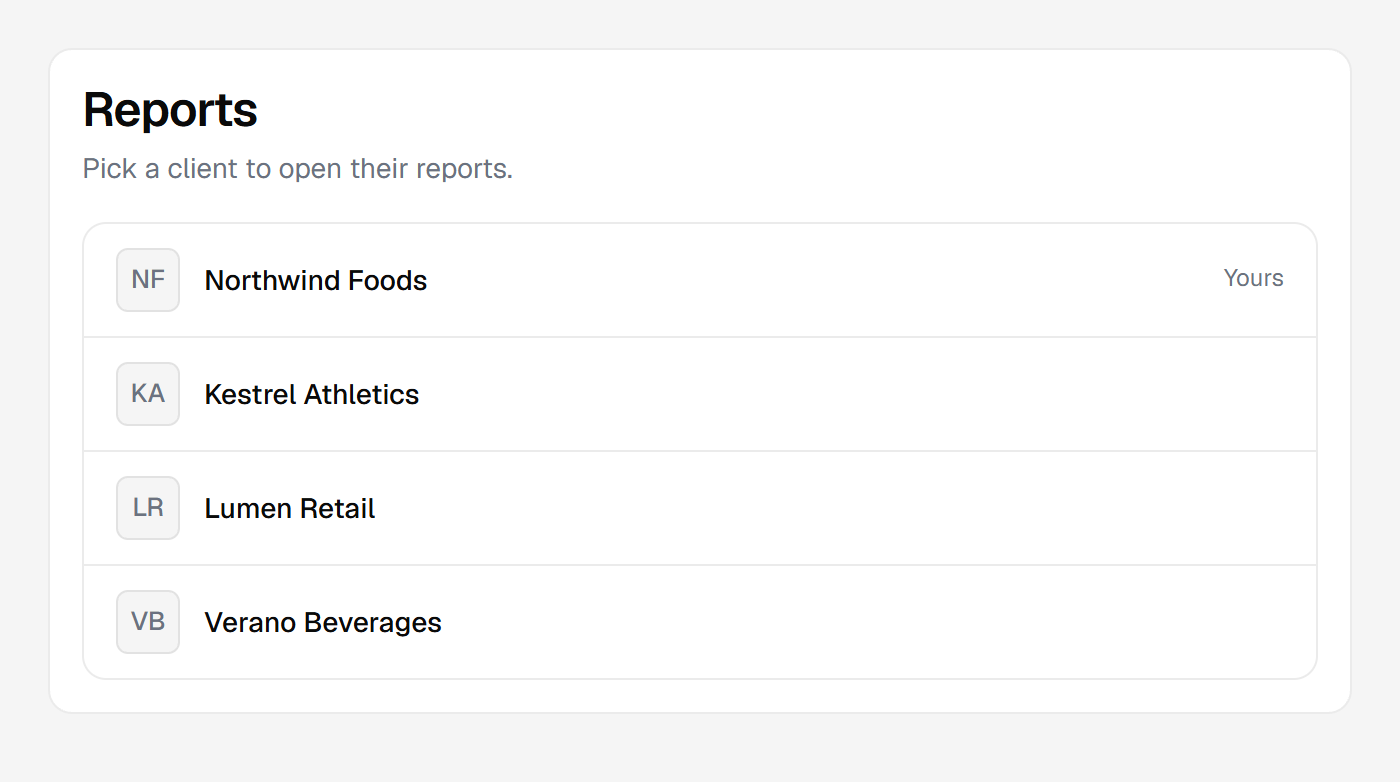
Every report lives on the reports page in the sidebar. It opens on a client picker — pick a client to land on their report index, then click any period to open that report as its own document.
The picker lists every client alphabetically. If you're a client's account manager, that client carries a quiet Yours marker and floats to the top — a convenience so a manager arriving from the bell finds their book fast. It's a marker, not a filter: you still see every client.
The per-client index
Picking a client shows their stored reports in two columns — Monthly reports on the left, Quarterly reports on the right. Each stored period is one row, newest first.
A report generated in the last week or so carries a New chip, so a fresh deliverable is visible at a glance.
Every period you've ever generated stays here: June stays browsable when July arrives, and last year's reports are one click away.
An empty column names the next run and the period it covers — "No quarterly reports yet — the next is due 3 November, covering July – September 2026." — meaning that client hasn't had one generated for that cadence yet.
A report opens as its own full document — cover first, then its sections. There are no report-type tabs: Monthly and Quarterly run on different cadences, so they're separate deliverables rather than two tabs of one period.
Once it's open, the top-right toggle switches between agency view and the client preview, and the share link controls sit in the toolbar. What you can read inside is the monthly walkthrough.